In the process of website operation, page access becomes slow is a common problem. Some webmasters encounter this problem as soon as theyslow loadingIn fact, page slowdowns and 504 Gateway Timeout errors are two different things. In fact, page slowdowns and 504 errors are two different manifestations of different nature, and the solutions are also very different.
This article will explain the difference between the two in detail, and introduce the use of Google Lighthouse and GTmetrix tools to determine the specific causes, to help analyze the root cause of the slow response of the site.
![Image [1]-Lighthouse and GTmetrix Guide to Distinguish Between Slow-Loading Websites and 504 Error Reporting](http://gqxi.cn/wp-content/uploads/2025/06/20250616094550434-image.png)
I. What is a 504 error? and the difference between slow access
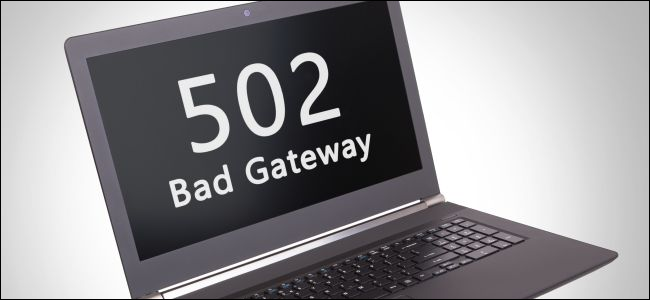
504 Gateway Timeout is a status code returned by the server indicating that the current server, when acting as a gateway or proxy, failed to obtain a response from the upstream server in time, resulting in a request timeout.
This error usually occurs in the following scenarios:
- PHP Excessive back-end execution time
- Database queries are congested or unresponsive for long periods of time
- Third party interface blocking
- Timed tasks or queue jams
in case of 504Browser pages tend to report errors or go blank outright, not as a result of slower loading, but as a result of interrupted requests. In contrast, thePage access slows downIt is shown as a gradual display of content, with the browser being loaded for a long time, but the display can still be completed in the end.
![Image [2]-Lighthouse and GTmetrix Guide to Distinguish Between Slow Loading Websites and 504 Errors](http://gqxi.cn/wp-content/uploads/2025/06/20250616094257656-image.png)
These two types of problems are easy to confuse at the presentation level, but are handled in completely different ways. The ability to distinguish between the two is critical for subsequent debugging.
Using Lighthouse to analyze page loading issues
Lighthouse is a built-in performance diagnostic tool for Chrome, suitable for checking page load performance, front-end resource handling, and interactive response times.
Open any page in Chrome and press F12 to open thedeveloperstool, click on the "Lighthouse" tab, select the analysis dimension and start the test. lighthouse generates a detailed report covering load speed, script execution, image optimization, structural integrity and more.
![Image [3]-Lighthouse and GTmetrix Guide to Distinguish Between Slow Loading Websites and 504 Errors](http://gqxi.cn/wp-content/uploads/2025/06/20250616095233107-image.png)
Key indicators include first timeContent Mapping(FCP), maximum content drawing (LCP), total blocking time (TBT), and cumulative layout offset (CLS). These metrics reflect the time it takes for a page to render completely from startup, identify blocking points, and find the root cause of slow loading.
![Image [4] - Lighthouse and GTmetrix Guide to Distinguishing Between Slow-Loading Websites and 504 Error Reporting](http://gqxi.cn/wp-content/uploads/2025/06/20250616095317716-image.png)
If Lighthouse is not functioning properly or is always waiting for a response, then consider the possibility of a server-side error, such as a 504.
Using GTmetrix to Analyze Page Response Details
GTmetrix is a free online performance analysis tool that is simple to use and comprehensive in its information, suitable for further diagnosing website load order and request bottlenecks.
![Image [5]-Lighthouse and GTmetrix Guide to Distinguish Between Slow Loading Websites and 504 Errors](http://gqxi.cn/wp-content/uploads/2025/06/20250616095504371-image.png)
Go to the official GTmetrix website, enter the URL you want to test, and the system will generate a full report in a few minutes. The tool not only provides performance scores, but also displays a waterfall view of resource loading, which allows you to visualize the performance of every CSS, JS, image file loading time.
![Image [6] - Lighthouse and GTmetrix Guide to Distinguishing Between Slow-Loading Websites and 504 Error Reporting](http://gqxi.cn/wp-content/uploads/2025/06/20250616095730155-image.png)
FAQs include:
- Images are uncompressed, causing slow loading
- Third-party scripts take too long
- High server response latency (long TTFB times)
![Image [7] - Lighthouse and GTmetrix Guide to Distinguish Between Slow Loading Websites and 504 Error Reporting](http://gqxi.cn/wp-content/uploads/2025/06/20250616095804868-image.png)
GTmetrix is better suited for analyzing scenarios where a page loads slowly over time. If the page eventually displays correctly but is slow, it is more likely to be a front-end performance issue rather than a 504 error.
IV. Practical Ways to Determine Whether or Not a 504 Is Wrong
If the page is unresponsive for a long time and then the "504 Gateway Timeout" message appears directly, or the browser interrupts the connection when loading, most of the cases belong to the back-end problem. At this time, you can check the error.log, PHP execution logs, database slow query logs, etc., to determine whether there is a script or interface execution timeout.
![Image [8] - Lighthouse and GTmetrix Guide to Distinguishing Between Slow Loading Websites and 504 Errors](http://gqxi.cn/wp-content/uploads/2025/06/20250616100046792-image.png)
And if the page eventually loads successfully, but the process is slow, it is recommended to first troubleshoot the front-end resources and loading process. Using Lighthouse and GTmetrix results will help to locate script blocking, cache invalidation,DNS Common problems such as delays.
V. Suggestions for further optimization
The optimization approach differs for different problem types:
When pages load slowly, consider compressing images, streamlining CSS and JS files, using a caching system, andContent Delivery Network(CDN) and other methods to optimize the front end.
When the server returns a 504 error, you should pay attention to back-end issues such as database query efficiency, interface responsiveness, PHP script runtime limitations, task queue stacking, etc., and optimize the server configuration and code execution logic appropriately.
![Image [9]-Lighthouse and GTmetrix Guide to Distinguish Between Slow Loading Websites and 504 Errors](http://gqxi.cn/wp-content/uploads/2025/06/20250616100318537-image.png)
VI. Summary
Slow site access and 504 errors may be similar on the surface, but they are essentially two different problems that go in different directions. Accurately identifying the cause is the first step in diagnosing and fixing the problem. With Lighthouse and GTmetrix, you can quickly determine where the performance bottlenecks are and help your site perform well in different scenarios.
The proper use of these tools has practical significance for technicians. If the site is oriented to multiple regions or has complex business logic, it is even more important to regularly monitor performance to avoid misjudgments that affect system stability and page accessibility.
Link to this article:http://gqxi.cn/en/59663The article is copyrighted and must be reproduced with attribution.










![Emoji[jingya]-Photonflux.com | Professional WordPress repair service, worldwide, rapid response](http://gqxi.cn/wp-content/themes/zibll/img/smilies/jingya.gif)


No comments